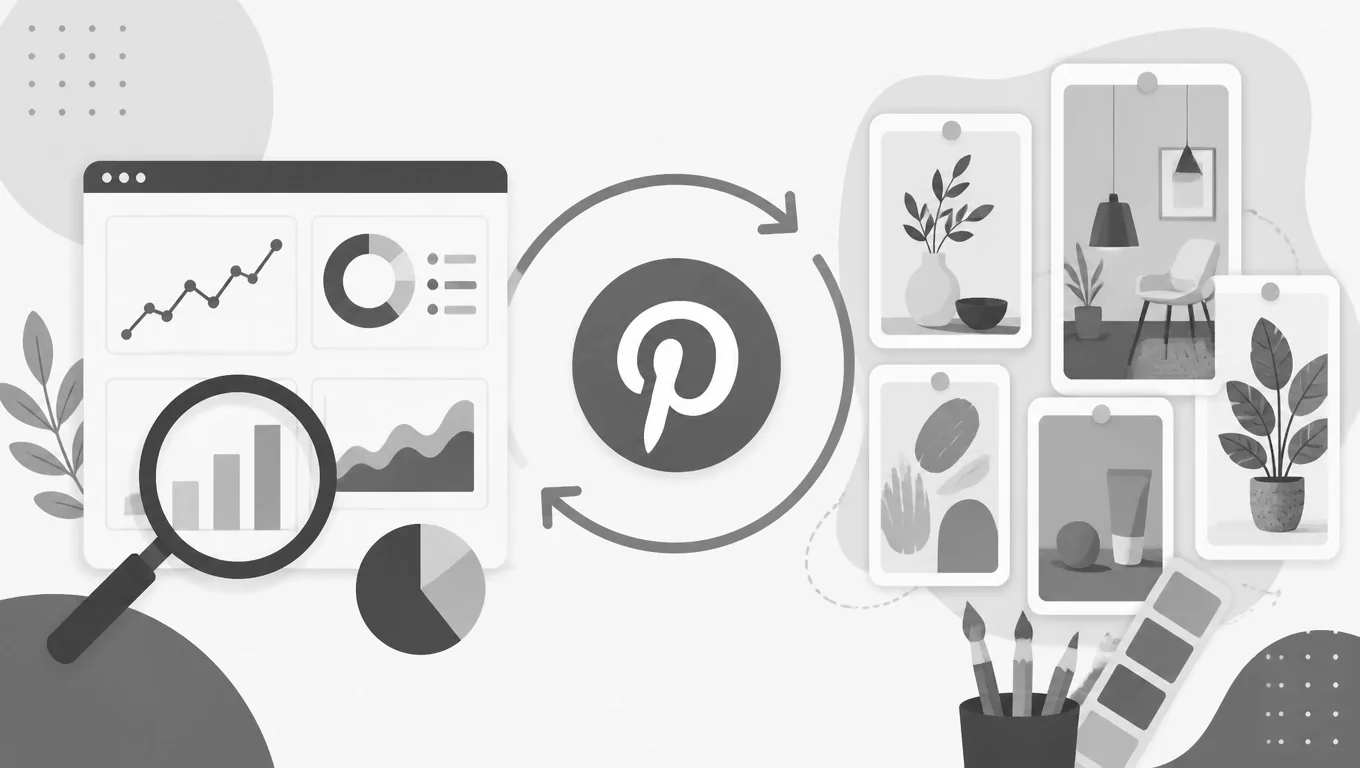
In the evolving landscape of digital marketing, Pinterest stands out not just as a social network, but as a visual search engine where content has a lifespan measured in years rather than hours[1]. To succeed in 2025 and beyond, businesses must move away from “throwing spaghetti at the wall” and embrace a data-driven strategy[2][3]. Leveraging Pinterest Analytics is the key to transforming raw data into a roadmap for continuous improvement and sustainable growth[4][5].
Prioritizing the Metrics That Matter
Understanding your performance begins with knowing which metrics actually signal success. While impressions show reach, they are just the starting point[6].
- Saves (The Intent Signal): On Pinterest, Saves are the ultimate metric of success[7]. They indicate that a Pinner found your idea so inspiring they want to revisit it and try it later[7][8]. High save rates suggest your content is resonating deeply with your audience’s future plans[9].
- Outbound Clicks (The ROI Driver): These measure the total number of people clicking through to your destination URL[10]. This is the primary way to gauge the effectiveness of your Pinterest strategy in driving traffic and potential revenue, as discussed in building a sustainable traffic engine through long-term strategies[11][12].
- Fresh Pins (Creates) vs. Saves: Analytics reveal a crucial truth: over 90% of traffic to creator and brand websites comes from “Fresh Pins” (original content) rather than saves of existing content[13]. Continuous improvement means consistently analyzing which new designs and topics are driving this distribution[14][15].
Mining Insights from the Trends Tool
One of the most powerful tools for continuous improvement is the Pinterest Trends tool[16][17]. This resource provides a historical and predictive view of what Pinners are searching for, often 90 days in advance[18][19].
By analyzing these trends, you can align your content calendar with rising search terms, ensuring your Pins feel timely and authentic when interest is at its peak[19]. Pinterest’s trend predictions have shown an 80% accuracy rate for three consecutive years, making it a reliable “crystal ball” for content planning[20].
Optimizing the Full-Funnel Journey
A sophisticated analytics strategy treats the Pinterest journey as a multi-stage funnel rather than a single interaction[21][22].
- Top of Funnel (Discovery): Use Impressions to see if your Pinterest SEO—keywords in titles, descriptions, and alt text—is working to surface your Pins in search results, as detailed in our guide on testing Pinterest Pin ideas for engagement[6][23].
- Middle of Funnel (Consideration): Monitor Save Rates and Pin Clicks[9]. If Pinners are clicking but not saving or visiting your site, your visual might be “scroll-stopping” but lacking a clear value proposition or call to action, which is crucial for creating engaging pins that drive conversions[9].
- Bottom of Funnel (Conversion): Use Conversion Insights and the Pinterest API for Conversions to track actions like “Add to Cart” and successful checkouts[24][25]. If your site visits are high but conversions are low, it’s a signal to optimize your website’s mobile performance or landing page relevance[25][26].
The Path to Growth: Test, Analyze, Iterate
The most successful brands on Pinterest use a batch-and-analyze workflow[27]. This involves creating multiple Pin variations for a single piece of content to see which design, headline, or keyword combination performs best[28][29].
Because Pinterest content is evergreen—with over 60% of saves coming from Pins over a year old—the work you do today to optimize a Pin based on analytics can continue to pay dividends for years[30][31].
Continuous improvement is a cycle: publish consistently, review your top-performing Pins monthly, identify the “formula” behind your winners, and replicate that success in your next batch of content
[15]. By letting data drive your decisions, you move from random posting to a sustainable, revenue-generating system
[2][32].